Onboarding
Growth
Holistic onboarding vision for Miro
Holistic onboarding vision for Miro
Holistic onboarding vision for Miro
From research to 45+ roadmap directions and experiments that moved the Aha moment.
From research to 45+ roadmap directions and experiments that moved the Aha moment.
From research to 45+ roadmap directions and experiments that moved the Aha moment.

About Miro
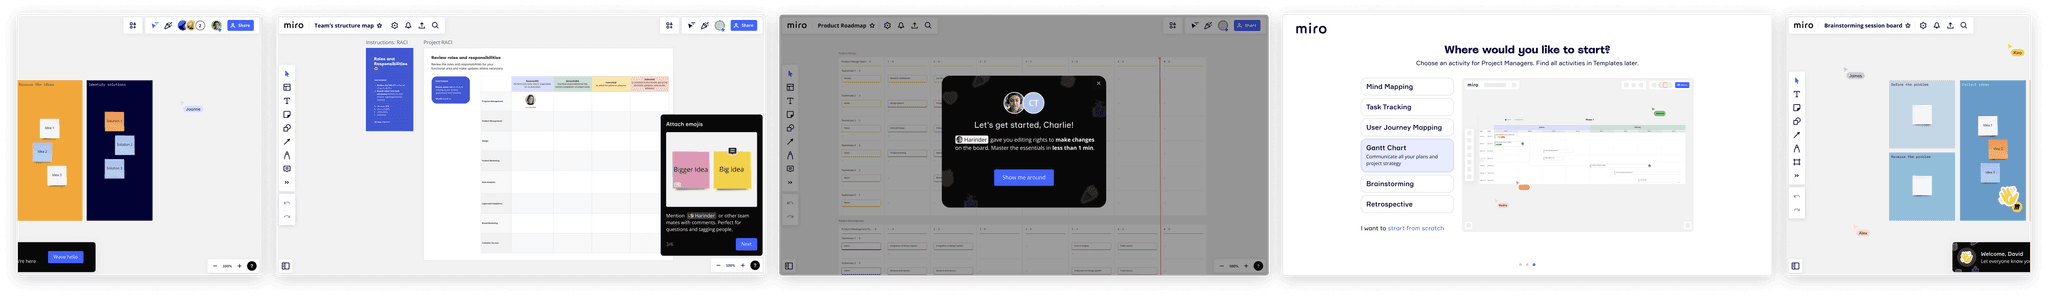
Miro is a collaborative whiteboard platform used by teams around the world to brainstorm, plan, and design together.
Skills
User Research
Holistic vision
Prototyping
UX/UI design
Facilitating Design Sprint
Stakeholder аlignment
Specs
Iterations
Experiment analysis
Business problems
46% of team creators become inactive right after the Setup moment, and 23% of joiners drop off after their first session.
46% of team creators become inactive right after the Setup moment, and 23% of joiners drop off after their first session.
46% of team creators become inactive right after the Setup moment, and 23% of joiners drop off after their first session.
Apex Inc.
Data dashboard
Project context
Help users reach their Aha moment in Miro. Create an onboarding vision that shapes experiments on the roadmap.
Help users reach their Aha moment in Miro. Create an onboarding vision that shapes experiments on the roadmap.
Apex Inc.
Data dashboard
+5,4%
Aha moment uplift
for Creators
+5,4%
Aha moment uplift
for Creators
+5,4% Aha moment uplift for Creators
+7,9%
total Aha moment
uplift for Joiners
+7,9%
total Aha moment
uplift for Joiners
+7,9% total Aha moment uplift for Joiners
45+ experiments
added to the team's roadmap
45+ experiments
added to the team's roadmap
45+ experiments added to the team's roadmap
Apex Inc.
Data dashboard
Project outcomes
Role
Role
Role
Product Designer
Product Designer
Product Designer
Team
Team
Team
Activation
Activation
Activation
Platforms
Platforms
Platforms
Browser App
Browser App
Browser App
Worked
with
Worked
with
Worked
with
PM
Analyst
Engineering team
XFN teams
PM
Analyst
Engineering team
XFN teams
PM
Analyst
Engineering team
XFN teams
Apex Inc.
Data dashboard
Highlights from experiments:
My role and team
As the sole designer on Activation, I led both vision and execution. Together with a brilliant PM, I shaped direction, aligned stakeholders, and stayed hands-on, from research to testing and iteration.
As the sole designer on Activation, I led both vision and execution. Together with a brilliant PM, I shaped direction, aligned stakeholders, and stayed hands-on, from research to testing and iteration.
As the sole designer on Activation, I led both vision and execution. Together with a brilliant PM, I shaped direction, aligned stakeholders, and stayed hands-on, from research to testing and iteration.

Process overview
Identifying business needs
Apex Inc.
Data dashboard
❶

Identifying business needs
Apex Inc.
Data dashboard
❶
Identifying business needs
Apex Inc.
Data dashboard
❶
Data
research
Apex Inc.
Data dashboard
❷
Data
research
Apex Inc.
Data dashboard
❷
Data
research
Apex Inc.
Data dashboard
❷
User
research
Apex Inc.
Data dashboard
❸
User
research
Apex Inc.
Data dashboard
❸
Conducting team workshop
Apex Inc.
Data dashboard
❹
Conducting team workshop
Apex Inc.
Data dashboard
❹
Building holistic vision
Apex Inc.
Data dashboard
❺
Prioritization and roadmap
Apex Inc.
Data dashboard
❻
Running 1st experiment and iterating
Apex Inc.
Data dashboard
❼
User
research
Apex Inc.
Data dashboard
❸
User
research
Apex Inc.
Data dashboard
❸
Conducting team workshop
Apex Inc.
Data dashboard
❹
Conducting team workshop
Apex Inc.
Data dashboard
❹
Building holistic vision
Apex Inc.
Data dashboard
❺
Building holistic vision
Apex Inc.
Data dashboard
❺
Prioritization and roadmap
Apex Inc.
Data dashboard
❻
Prioritization and roadmap
Apex Inc.
Data dashboard
❻
Running 1st experiment and iterating
Apex Inc.
Data dashboard
❼
Running 1st experiment and iterating
Apex Inc.
Data dashboard
❼
Building holistic vision
Apex Inc.
Data dashboard
❺
Building holistic vision
Apex Inc.
Data dashboard
❺
Prioritization and roadmap
Apex Inc.
Data dashboard
❻
Prioritization and roadmap
Apex Inc.
Data dashboard
❻
Running 1st experiment and iterating
Apex Inc.
Data dashboard
❼
Running 1st experiment and iterating
Apex Inc.
Data dashboard
❼
User Research
User Research
User Research
At this stage, we lacked a complete picture of what new users experience in their first sessions.
At this stage, we lacked a complete picture of what new users experience in their first sessions.
At this stage, we lacked a complete picture of what new users experience in their first sessions.
Goal
Goal
Goal
Identify blockers preventing Creators and Joiners from getting value during early sessions.
Identify blockers preventing Creators and Joiners from getting value during early sessions.
Identify blockers preventing Creators and Joiners from getting value during early sessions.
View the research outcomes I presented to the team here: 🔗 explore in Miro
View the research outcomes I presented to the team here: 🔗 explore in Miro
Expand more research details
Research setup
Process overview
User journeys
Research setup
Interviews: 10 total (5 Creators, 5 Joiners)
Timeline: ~1.5 weeks for interviews and analysis
Process overview
Research planning
Apex Inc.
Data dashboard
❶
Hypotheses brainstorm
Apex Inc.
Data dashboard
❷
Survey to get relevant participants
Apex Inc.
Data dashboard
❸
User interviews
Apex Inc.
Data dashboard
❹
Insights summary
Apex Inc.
Data dashboard
❺
Story map for Creators and Joiners
Apex Inc.
Data dashboard
❻
User journeys
We uncovered new issues and mapped the full journey for Joiners and Creators, highlighting the most confusing moments and showing where to focus next.
🔗 Explore in Miro

Expand more research details
Research setup
Process overview
User journeys
Research setup
Interviews: 10 total (5 Creators, 5 Joiners)
Timeline: ~1.5 weeks for interviews and analysis
Process overview
Research
planning
Apex Inc.
Data dashboard
❶
Hypotheses brainstorm
Apex Inc.
Data dashboard
❷
Survey to get participants
Apex Inc.
Data dashboard
❸
User
interviews
Apex Inc.
Data dashboard
❹
Insights
summary
Apex Inc.
Data dashboard
❺
Story map (Creators, Joiners)
Apex Inc.
Data dashboard
❻
User journeys
We uncovered new issues and mapped the full journey for Joiners and Creators, helping us see the order of problems and what matters most to users along the way / 🔗 Explore in Miro
Expand more research details
Research setup
Process overview
User journeys
Research setup
Interviews:
10 total (5 Creators, 5 Joiners)
Timeline:
~1.5 weeks for interviews and analysis
Process overview
Research planning
Apex Inc.
Data dashboard
❶
Hypotheses brainstorm
Apex Inc.
Data dashboard
❷
Survey to get participants
Apex Inc.
Data dashboard
❸
User interviews
Apex Inc.
Data dashboard
❹
Insights summary
Apex Inc.
Data dashboard
❺
Story map (Creators, Joiners)
Apex Inc.
Data dashboard
❻
User journeys
We uncovered new issues and mapped the full journey for Joiners and Creators, helping us see the order of problems and what matters most to users along the way / 🔗 Explore in Miro
Main learnings:
Main learnings:
Main learnings:

Creator

Team concept isn't clear
Too broad use cases, hard to pick the right one
It's hard to choose the right template
Users don't understand Miro's flexibility
Users don't see best practices examples
Creators fear Joiners might
break the board
Creators fear Joiners might
break the board
Can't find relevant tools for their sessions
It's hard to teach new teammates how to use Miro
Struggling
with joiners' engagement
Struggling
with joiners' engagement

Too broad use cases, hard to pick the right one
It's hard to choose the right template
Creators fear Joiners might break the board
Can't find relevant tools for their sessions
Struggling with joiners' engagement
Apex Inc.
Data dashboard

Joiner
Hard to find relevant use cases
Navigation on
a board is hard
Afraid to break someone else’s board
Too many features overwhelm
Not sure how to interact during collaboration
Users don’t get enough guidance to get started
Apex Inc.
Data dashboard
Joiner
Hard to find relevant use cases
Navigation on
a board is hard
Too many features overwhelm
Afraid to break someone else’s board
Not sure how to interact during collaboration
Users don’t get enough guidance to get started
Navigation on a board is hard
Afraid to break someone else’s board
Not sure how to interact during collaboration
Users don’t get enough guidance to get started
Apex Inc.
Data dashboard
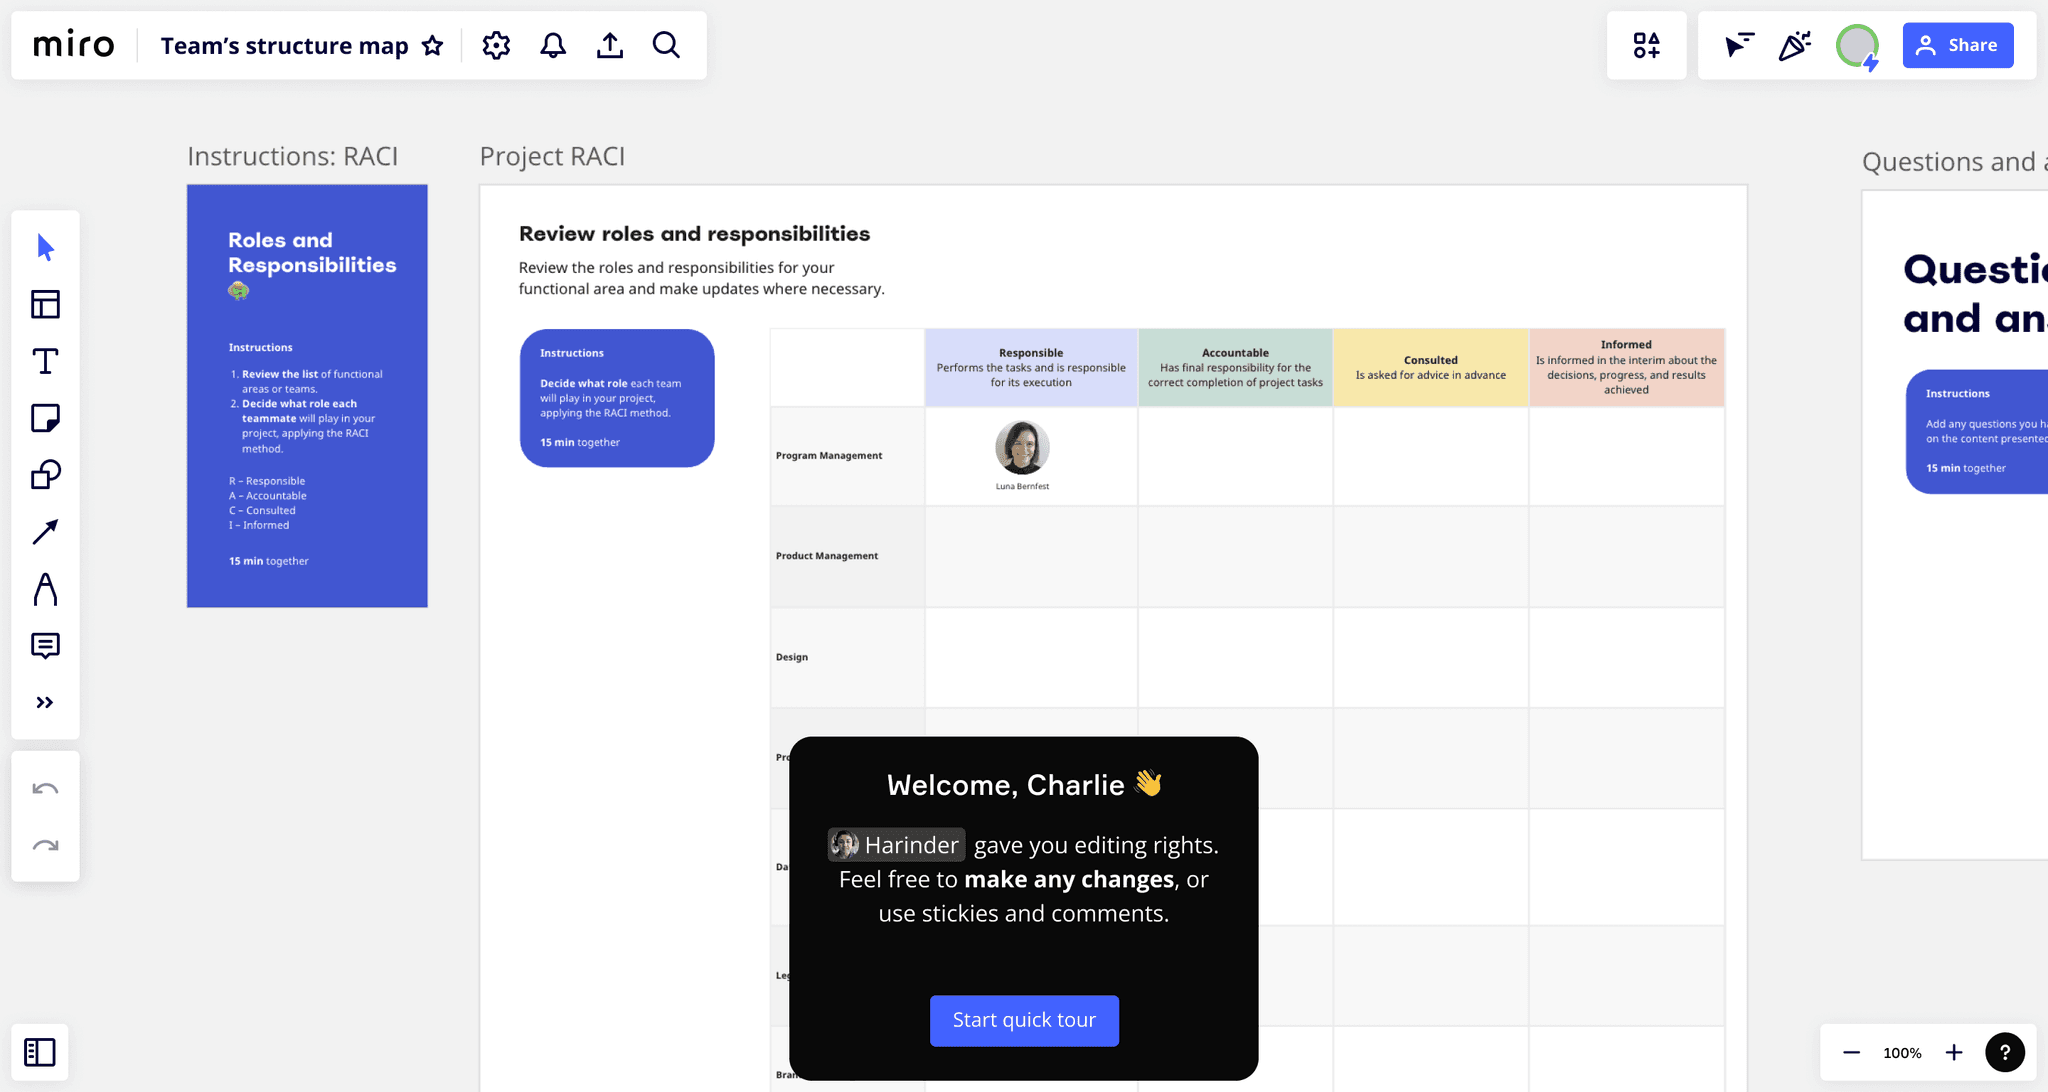
Workshop
Workshop
To kick off the solution phase, I led a 3-day workshop. We brought in different roles and leadership early to spark diverse ideas and align on potential experiment paths.
To kick off the solution phase, I led a 3-day workshop. We brought in different roles and leadership early to spark diverse ideas and align on potential experiment paths.
Goals
Goals
Ensure early cross-functional collaboration
Brainstorm and prioritize experimentation directions
Align stakeholders on strategic areas
Ensure early cross-functional collaboration
Brainstorm and prioritize experimentation directions
Align stakeholders on strategic areas

Expand more workshop details
Workshop setup
Process overview
Team takeaways
Workshop setup
3-day workshop, over ~3 hours each day, 8 participants tackled 4 key problems across both user segments.
Process overview
Problem prioritization
Apex Inc.
Data dashboard
❶
How Might We exercise
Apex Inc.
Data dashboard
❷
Ideation session
Apex Inc.
Data dashboard
❸
Crazy 8 session
Apex Inc.
Data dashboard
❹
Clastering and voting
Apex Inc.
Data dashboard
❺
List of ideas and directions
Apex Inc.
Data dashboard
❻
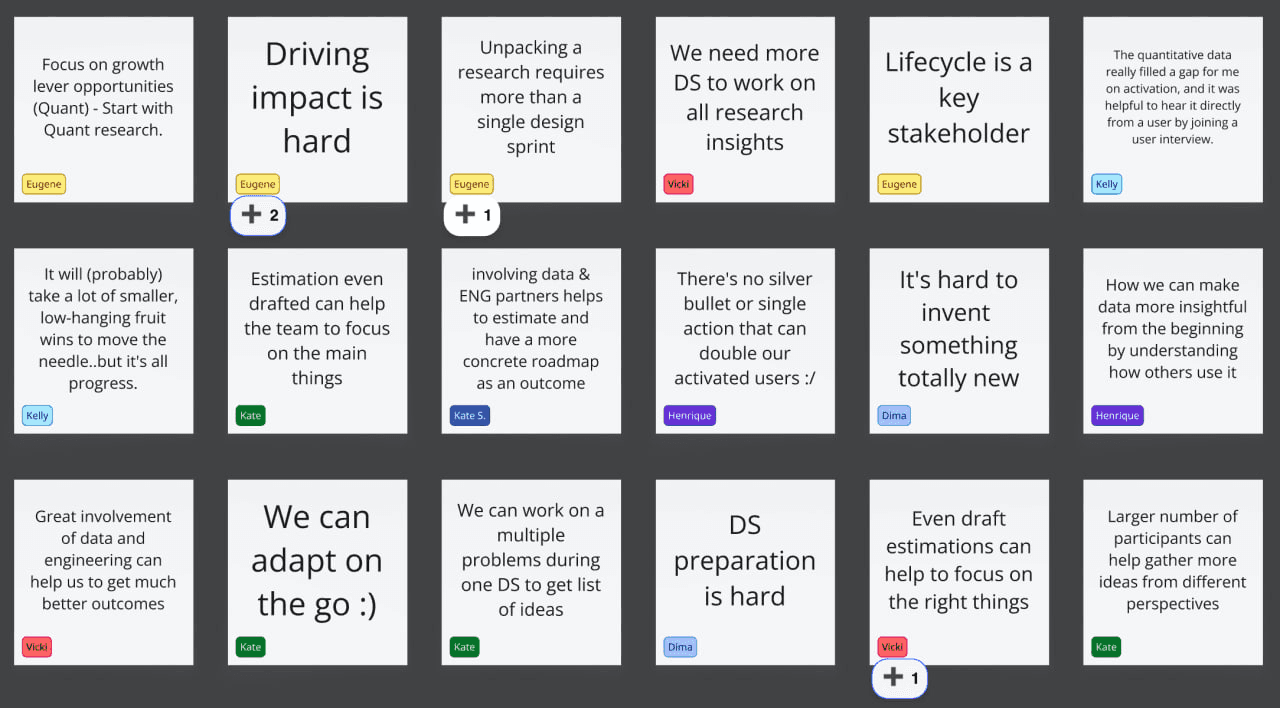
Team takeaways
At the end of the 3-day workshop, we ran a short retro to reflect on the format and surface additional insights. Here’s what the team shared:
Liked

Apex Inc.
Data dashboard
Learned
Apex Inc.
Data dashboard
Workshop setup
3-day workshop, over ~3 hours each day, 8 participants tackled 4 key problems across both user segments.
Process overview
Problem prioritization
Apex Inc.
Data dashboard
❶
How Might We exercise
Apex Inc.
Data dashboard
❷
Ideation
session
Apex Inc.
Data dashboard
❸
Crazy 8
session
Apex Inc.
Data dashboard
❹
Clastering and voting
Apex Inc.
Data dashboard
❺
List of ideas and directions
Apex Inc.
Data dashboard
❻
Team takeaways
At the end of the 3-day workshop, we ran a short retro to reflect on the format and surface additional insights. Here’s what the team shared:
Liked
Apex Inc.
Data dashboard
Learned
Apex Inc.
Data dashboard
Workshop setup
3-day workshop, over ~3 hours each day, 8 participants tackled 4 key problems across both user segments.
Process overview
Problem prioritization
Apex Inc.
Data dashboard
❶
How Might We exercise
Apex Inc.
Data dashboard
❷
Ideation session
Apex Inc.
Data dashboard
❸
Crazy 8 session
Apex Inc.
Data dashboard
❹
Clastering and voting
Apex Inc.
Data dashboard
❺
List of ideas and directions
Apex Inc.
Data dashboard
❻
Expand more workshop details
Workshop setup
Process overview
Workshop setup
3-day workshop, over ~3 hours each day, 8 participants tackled 4 key problems across both user segments.
Process overview
Problem prioritization
Apex Inc.
Data dashboard
❶
How Might We exercise
Apex Inc.
Data dashboard
❷
Ideation session
Apex Inc.
Data dashboard
❸
Crazy 8 session
Apex Inc.
Data dashboard
❹
Clastering and voting
Apex Inc.
Data dashboard
❺
List of ideas and directions
Apex Inc.
Data dashboard
❻
Key outcomes
Key outcomes
45+ ideas prioritized and added to the backlog with early estimations from engineers and analysts
Clear alignment with stakeholders on key directions to explore next
45+ ideas prioritized and added to the backlog with early estimations from engineers and analysts
Clear alignment with stakeholders on key directions to explore next
Working board:
overview with all
steps combined


Workshop
To kick off the solution phase, I led a 3-day workshop. We brought in different roles and leadership early to spark diverse ideas and align on potential experiment paths.
Goals
Ensure early cross-functional collaboration
Brainstorm and prioritize experimentation directions
Align stakeholders on strategic areas
Expand more workshop details
Workshop setup
Process overview
Team takeaways
Workshop setup
3-day workshop, over ~3 hours each day, 8 participants tackled 4 key problems across both user segments.
Process overview
Problem prioritization
Apex Inc.
Data dashboard
❶
How Might We exercise
Apex Inc.
Data dashboard
❷
Ideation
session
Apex Inc.
Data dashboard
❸
Crazy 8
session
Apex Inc.
Data dashboard
❹
Clastering and voting
Apex Inc.
Data dashboard
❺
List of ideas and directions
Apex Inc.
Data dashboard
❻
Team takeaways
At the end of the 3-day workshop, we ran a short retro to reflect on the format and surface additional insights. Here’s what the team shared:
Liked
Apex Inc.
Data dashboard
Learned
Apex Inc.
Data dashboard
Workshop setup
3-day workshop, over ~3 hours each day, 8 participants tackled 4 key problems across both user segments.
Process overview
Problem prioritization
Apex Inc.
Data dashboard
❶
How Might We exercise
Apex Inc.
Data dashboard
❷
Ideation session
Apex Inc.
Data dashboard
❸
Crazy 8 session
Apex Inc.
Data dashboard
❹
Clastering and voting
Apex Inc.
Data dashboard
❺
List of ideas and directions
Apex Inc.
Data dashboard
❻
Expand more workshop details
Workshop setup
Process overview
Team takeaways
Workshop setup
3-day workshop, over ~3 hours each day, 8 participants tackled 4 key problems across both user segments.
Process overview
Problem prioritization
Apex Inc.
Data dashboard
❶
How Might We exercise
Apex Inc.
Data dashboard
❷
Ideation
session
Apex Inc.
Data dashboard
❸
Crazy 8
session
Apex Inc.
Data dashboard
❹
Clastering and voting
Apex Inc.
Data dashboard
❺
List of ideas and directions
Apex Inc.
Data dashboard
❻
Team takeaways
At the end of the 3-day workshop, we ran a short retro to reflect on the format and surface additional insights. Here’s what the team shared:
Liked
Apex Inc.
Data dashboard
Learned
Apex Inc.
Data dashboard
Workshop setup
3-day workshop, over ~3 hours each day, 8 participants tackled 4 key problems across both user segments.
Process overview
Problem prioritization
Apex Inc.
Data dashboard
❶
How Might We exercise
Apex Inc.
Data dashboard
❷
Ideation session
Apex Inc.
Data dashboard
❸
Crazy 8 session
Apex Inc.
Data dashboard
❹
Clastering and voting
Apex Inc.
Data dashboard
❺
List of ideas and directions
Apex Inc.
Data dashboard
❻
Key outcomes
45+ ideas prioritized and added to the backlog with early estimations from engineers and analysts
Clear alignment with stakeholders on key directions to explore next
Working board:
overview with all
steps combined
Holistic vision
I pulled the main ideas into structured flows so we could test them as one system, not as scattered experiments.
Goals
Visualize workshop ideas in more detail for both segments
Connect them into a single holistic system
Create a foundation for backlog planning and experiment prioritization
Key outcomes
11 prioritized ideas for the next quarter, targeting a potential 5% Aha uplift
Unified onboarding flow translated into S/M/L experiments for execution
Single source of truth for both segments: MVP scope, full ideas, and key test areas.

1st experiment
Team Joiners
Contextual invites with
actionable onboarding
Contextual invites with
actionable onboarding
Contextual invites with actionable onboarding

+4,8%
Aha uplift
+4,8%
Aha uplift
Joiners make up 80% of new users, and usually start with async session, so we started with them.
Joiners make up 80% of new users, and usually start with async session, so we started with them.
Joiners make up 80% of new users, and usually start with async session, so we started with them.
Joiners' problems
Joiners' problems
Joiners' problems
Navigation on a board is hard
Afraid to break someone else’s board
Users don’t get enough guidance to get started
Navigation on a board is hard
Afraid to break someone else’s board
Users don’t get enough guidance to get started
Navigation on a board is hard
Afraid to break someone else’s board
Users don’t get enough guidance to get started
+4,8% Aha uplift
Final result
Hypothesis
Hypothesis
Hypothesis
We believe that by guiding async Joiners with a personal invite, navigation tutorial and a relevant tools overview, we can boost their confidence to collaborate on someone else's boards, increasing Aha and Activation.
We believe that by guiding async Joiners with a personal invite, navigation tutorial and a relevant tools overview, we can boost their confidence to collaborate on someone else's boards, increasing Aha and Activation.
We believe that by guiding async Joiners with a personal invite, navigation tutorial and a relevant tools overview, we can boost their confidence to collaborate on someone else's boards, increasing Aha and Activation.
1st iteration setup
A/B test for new Team Joiners joining a sync session for the first time on someone else's board.
Group A
Previous flow
Group B
New flow with
1) Invite context
2) Navigation tutorial
3) Tools overview
Group A
Previous flow
Known issues
Hard to learn navigation just from static descriptions
No clear connection between tool tips and their location
Repetitive info that doesn’t match Joiners' real first-time needs
Group B
New flow
Invite context
Creating familiarity & setting expectations. Message inviting the Joiner to edit the board coming from Inviters, giving Joiners a sense of what's expected from them.
Group B
New flow
Navigation tutorial
Using "learn by doing" existing pattern (Zoom in / Zoom out, & scrolling) as Joiners usually have low awareness about Miro, not knowing how to get started & use an infinite canvas.
Group B
New flow
Tools overview
Improving the flow with more contextual tips, cleaner animations, streamlined collaboration tools (e.g., sticky notes, reactions, mentions), and removed redundant content.
1st iteration setup
A/B test for new Team Joiners joining a sync session for the first time on someone else's board.
Web design
Previous flow
Web design
New flow with
1) Invite context
2) Navigation tutorial
3) Tools overview
Group A
Previous flow
Known issues
Hard to learn navigation just from static descriptions
No clear connection between tool tips and their location
Repetitive info that doesn’t match Joiners' real first-time needs
Group B
New flow
Invite context
Creating familiarity & setting expectations. Message inviting the Joiner to edit the board coming from Inviters, giving Joiners a sense of what's expected from them.
Group B
New flow
Navigation tutorial
Using "learn by doing" existing pattern (Zoom in / Zoom out, & scrolling) as Joiners usually have low awareness about Miro, not knowing how to get started & use an infinite canvas.
Group B
New flow
Tools overview
Improving the flow with more contextual tips, cleaner animations, streamlined collaboration tools (e.g., sticky notes, reactions, mentions), and removed redundant content.
1st iteration results
1st iteration results
1st iteration results
Slightly negative Aha, but double-digit improvement
for 4 out 5 behaviors:
Slightly negative Aha, but double-digit improvement for 4 out 5 behaviors:
Slightly negative Aha, but double-digit improvement for 4 out 5 behaviors:

–2,4% users reaching Aha
P-Value 0.1
+21% users commented
+67% users added mention
–2,4% users reaching Aha
P-Value 0.1
–2,4% users reaching Aha
–2,4% users reaching Aha
P-Value 0.1
–2,4% users reaching Aha
+21% users commented
+21% users commented
+21% users commented
+21% users commented
+67% users added mention
+67% users added mention
+12,3% users added a sticky note
+53% users reacted on sticky note
+12,3% users added a sticky note
+53% users reacted on sticky note
Learnings
Learnings
Learnings
96% of users that performed the tour reached Aha
96% of users that performed the tour reached Aha
96% of users that performed the tour reached Aha
Great validation that bringing more users to start & complete the tour will likely be reflected in increases in Aha
Great validation that bringing more users to start & complete the tour will likely be reflected in increases in Aha
Great validation that bringing more users to start & complete the tour will likely be reflected in increases in Aha
Apex Inc.
Data dashboard
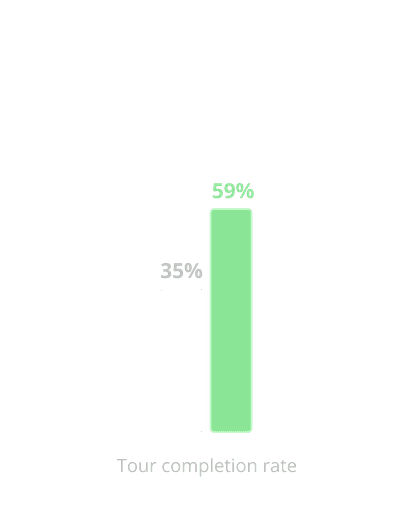
Very good tour completion rate
Very good tour completion rate
Very good tour completion rate
35% of users starting the tour complete it. 20–25% can be considered good!
35% of users starting the tour complete it. 20–25% can be considered good!
35% of users starting the tour complete it. 20–25% can be considered good!
Apex Inc.
Data dashboard
Tip positioning makes
a difference
Tip positioning makes a difference
Tip positioning makes
a difference
Using tip tours with gifs positioned to the tool is effective to drive user behavior
Using tip tours with gifs positioned to the tool is effective to drive user behavior
Using tip tours with gifs positioned to the tool is effective to drive user behavior

Apex Inc.
Data dashboard
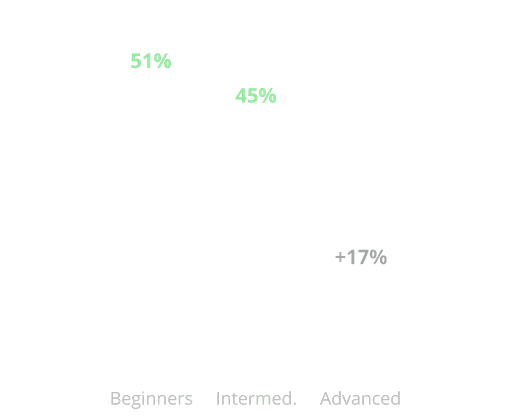
Proficiency levels are important
Proficiency levels are important
Proficiency levels are important
Onboarding tours should be segmented per proficiency level to match users experience in the tool.
Onboarding tours should be segmented per proficiency level to match users experience in the tool.
Onboarding tours should be segmented per proficiency level to match users experience in the tool.
Tour start rate:
Apex Inc.
Data dashboard
Investigation
Investigation
Investigation
We analyzed the funnel and found two key drop-offs: low entry point clicks and major churn at the Navigation Tutorial.
We first made the tutorial non-skippable, based on learnings from Creators. But for Joiners, this approach didn’t work.
We analyzed the funnel and found two key drop-offs: low entry point clicks and major churn at the Navigation Tutorial.
We first made the tutorial non-skippable, based on learnings from Creators. But for Joiners, this approach didn’t work.
We analyzed the funnel and found two key drop-offs: low entry point clicks and major churn at the Navigation Tutorial.
We first made the tutorial non-skippable, based on learnings from Creators. But for Joiners, this approach didn’t work.

Possible improvements
Possible improvements
Possible improvements
Increase the click rate on the tutorial entry point
Test a skippable version of the navigation tutorial
Increase the click rate on the tutorial entry point
Test a skippable version of the navigation tutorial
Increase the click rate on the tutorial entry point
Test a skippable version of the navigation tutorial
2nd iteration setup
We ran one more A/B test, improving areas from the previous investigation for group B:
Improved visibility of the invite screen
Added an option to skip the navigation tutorial
Group A
Previous invite screen
Known issues
Entry point isn’t engaging and visible enough. Improving it could boost tour starts and completions, and increase Aha, as 96% of users who followed the streamlined path reached it.
Group B
New invite screen
What we changed
Made the entry point clearer and more visible to drive more users to start and complete the tour.
2nd iteration results
2nd iteration results
2nd iteration results
Positive Aha and improved results for secondary metrics
Positive Aha and improved results for secondary metrics
Positive Aha and improved results for secondary metrics
+4,8% users reached Aha
+47% users commented
+78% users added mention
+4,8% users reached Aha
+47% users commented
+78% users added mention
+15% users added a sticky note
+70% users reacted on sticky note
+4,8% users reached Aha
+47% users commented
+78% users added mention
+15% users added a sticky note
+70% users reacted on sticky note
Iterations comparison
Iterations comparison
Tour completion
Tour completion
Apex Inc.
Data dashboard
Tour funnel, iteration 2 vs iteration 1
Tour funnel, iteration 2 vs iteration 1

Apex Inc.
Data dashboard
1st iteration
2nd iteration
Next steps
Next steps
Next steps
To validate the concept quickly, we started with an MVP. Next, we aimed to expand personalization and test similar approach with other segments. Similar experiment for Creators also showed nice improvements.
To validate the concept quickly, we started with an MVP. Next, we aimed to expand personalization and test similar approach with other segments. Similar experiment for Creators also showed nice improvements.
To validate the concept quickly, we started with an MVP. Next, we aimed to expand personalization and test similar approach with other segments. Similar experiment for Creators also showed nice improvements.
2nd experiment
Team Creators
Personalized onboarding
based on users’ roles & goals
Personalized onboarding
based on users’ roles & goals
Personalized onboarding
based on users’ roles & goals
Next, we focused on Creators — guiding them to start with the most relevant use case and template.
Next, we focused on Creators — guiding them to start with the most relevant use case and template.
Next, we focused on Creators — guiding them to start with the most relevant use case and template.
+5,4% Aha uplift
+5,4% Aha uplift
Creators' problems
Creators' problems
Creators' problems
Too broad use cases, hard to pick the right one
It's hard to choose the right template
Too broad use cases, hard to pick the right one
It's hard to choose the right template
Too broad use cases, hard to pick the right one
It's hard to choose the right template
Hypothesis
Hypothesis
Hypothesis
We believe that personalizing the onboarding experience based on users’ roles and goals will reduce cognitive load and help more users realize value faster, leading to a higher Aha moment rate.
We believe that personalizing the onboarding experience based on users’ roles and goals will reduce cognitive load and help more users realize value faster, leading to a higher Aha moment rate.
We believe that personalizing the onboarding experience based on users’ roles and goals will reduce cognitive load and help more users realize value faster, leading to a higher Aha moment rate.
Final result
+5,4% Aha uplift
Experiment setup
A/B test for new Team Creators, product and project managers only.
Group A
Previous use cases page
Group B
New use cases page with personalized suggestions based on users' role
Group A
Previous use cases
Known issues
Use cases don’t align with the role selected in the previous step
They're too generic, making it hard for users to connect them with their goal
Selected use case leads to irrelevant templates, reducing its value
Group B
New use cases page
What we changed
Tailored use cases based on selected role
Narrower, more relevant framing for each role
Each use case now opens a linked template, so users start with relevant content and onboarding
Experiment setup
A/B test for new Team Creators, product and project managers only.
Web design
Previous use cases page
Web design
New use cases page with personalized suggestions based on users' role
Group A
Previous use cases
Known issues
Use cases don’t align with the role selected in the previous step
They're too generic, making it hard for users to connect them with their goal
Selected use case leads to irrelevant templates, reducing its value
Group B
New use cases page
What we changed
Tailored use cases based on selected role
Narrower, more relevant framing for each role
Each use case now opens a linked template, so users start with relevant content and onboarding
Results
Results
Results
More users reaching Aha
and returning to templates after day one
More users reaching Aha
and returning to templates after day one
More users reaching Aha
and returning to templates after day one
+5,4%
in Aha
+5,4%
in Aha
+85%
users starting with a template
+85%
users
starting with
a template
+4,6%
users added templates on day 2+
P-Value 0.1
+4,6%
users added templates on day 2+
P-Value 0.1
+5,4%
in Aha
+85%
users starting with a template
+4,6%
users added templates on day 2+
Next steps
Next steps
Next steps
The team scaled the approach to web onboarding, tailoring flows by entry point and seeing +10% in first-week retention.
Next, we focused on personalized, interactive tutorials within the first boards.
The team scaled the approach to web onboarding, tailoring flows by entry point and seeing +10% in first-week retention.
Next, we focused on personalized, interactive tutorials within the first boards.
The team scaled the approach to web onboarding, tailoring flows by entry point and seeing +10% in first-week retention.
Next, we focused on personalized, interactive tutorials within the first boards.
3rd experiment
Team Joiners
Say Hi prompt
Say Hi prompt
Say Hi prompt
We wanted to help Joiners feel more confident and engaged when they land on a board. This experiment tested a simple nudge encouraging them to say hi during a sync session.
We wanted to help Joiners feel more confident and engaged when they land on a board. This experiment tested a simple nudge encouraging them to say hi during a sync session.
We wanted to help Joiners feel more confident and engaged when they land on a board. This experiment tested a simple nudge encouraging them to say hi during a sync session.
+3,1%
Aha uplift
+3,1%
Aha uplift
Joiners' problems
Joiners' problems
Joiners' problems
Joiners are not sure how to interact during collaboration
Creators are struggling with joiners' engagement
Joiners are not sure how to interact during collaboration
Creators are struggling with joiners' engagement
Joiners are not sure how to interact during collaboration
Creators are struggling with joiners' engagement
Hypothesis
Hypothesis
Hypothesis
We believe that breaking the ice for new board joiners by nudging them to take a simple, delightful collaborative action will reduce their fear of engaging with the board and increase the Aha moment.
We believe that breaking the ice for new board joiners by nudging them to take a simple, delightful collaborative action will reduce their fear of engaging with the board and increase the Aha moment.
We believe that breaking the ice for new board joiners by nudging them to take a simple, delightful collaborative action will reduce their fear of engaging with the board and increase the Aha moment.
Final result
+3,1% Aha uplift
Experiment setup
A/B test for new Team Joiners joining a sync session for the first time on someone else's board.
Group A
Previous flow
Group B
Updated flow that nudged Joiners to say Hello
Group A
Previous flow
Known issues
Joiners are unsure what to do when invited to a board
Joiners are reluctant to interact with teammates
Joiners in sync sessions don't have much time to watch onboarding videos
Group B
Updated flow
What we changed
Clear CTA triggering Joiners to interact with other participants via Wave reaction
Short flow suitable for sync collaboration
Experiment setup
A/B test for new Team Joiners joining a sync session for the first time on someone else's board.
Web design
Previous flow
Web design
Updated flow that nudged Joiners to say Hello
Group A
Previous flow
Known issues
Joiners are unsure what to do when invited to a board
Joiners are reluctant to interact with teammates
Joiners in sync sessions don't have much time to watch onboarding videos
Group B
Updated flow
What we changed
Clear CTA triggering Joiners to interact with other participants via Wave reaction
Short flow suitable for sync collaboration
Results
Results
Results
More users reached Aha faster by breaking the ice and engaging early in the session
More users reached Aha faster by breaking the ice and engaging early in the session
More users reached Aha faster by breaking the ice and engaging early in the session
+3,1%
in Aha
–20%
average days to Aha
+3,1%
in Aha
–20%
average days to Aha
Next steps
Next steps
Next steps
Support facilitators by showing contextual tips for the right tools at the right moment, helping new users during live sessions.
Also, test the new onboarding approach for different segments, applying insights from the workshop and holistic vision to refine and personalize the experience.
Support facilitators by showing contextual tips for the right tools at the right moment, helping new users during live sessions.
Also, test the new onboarding approach for different segments, applying insights from the workshop and holistic vision to refine and personalize the experience.
Support facilitators by showing contextual tips for the right tools at the right moment, helping new users during live sessions.
Also, test the new onboarding approach for different segments, applying insights from the workshop and holistic vision to refine and personalize the experience.
Overall summary for the three experiments
Our prep work did more than fill the roadmap — it set the foundation for a connected, scalable onboarding system. Experiments were aligned with a bigger vision and reused across product areas.
Most wins came in the second iteration: even if the first tests were flat or negative, quick follow-ups led to real impact.
Aha moment uplift: +7.9% for Joiners, +4.8% for Creators
Aha moment uplift: +7.9% for Joiners, +4.8% for Creators
Aha moment uplift: +7.9% for Joiners, +4.8% for Creators
Apex Inc.
Data dashboard

A unified onboarding system mapped across key segments
A unified onboarding system mapped across key segments
A unified onboarding system mapped across key segments
Apex Inc.
Data dashboard
A validated flexible roadmap for multiple quarters ahead
A validated flexible roadmap for multiple quarters ahead
A validated flexible roadmap for multiple quarters ahead
Apex Inc.
Data dashboard
Next study
Engagement
Growth
Helping Miro users adopt new use cases
Helping Miro users adopt new use cases
Driving deeper product adoption by connecting users to the right tools for their goals.
Driving deeper product adoption by connecting users to the right tools for their goals.


Engagement
Growth
Helping Miro users adopt new use cases
Driving deeper product adoption by connecting users to the right tools for their goals.
Kate Lya 2025
Amsterdam
Kate Lya 2025
Amsterdam